
For the quarter ended March 31, 2017, the fund’s net asset value increased by 4.74% after fees. Since inception in October 2011, the annualised gross return was 11.40% and the estimated annualised gross return on our equity investments was 20.76%[1]. Please refer to your statements for individual performances based on the timing of your investment.
The fund was 60.85% invested at the end of the quarter.
Performance:
June
December
March
June
September
December
2017
2011*
1.60%
2012
6.13%
2013
9.04%
2014
9.30%
2015
15.32%
2016**
13.39%
2017
12.66%
2018
-3.13%
2019
21.09%
2020
7.08%
2021
17.74%
2022
-10.92%
2023
14.62%
2017
Q1
4.74%
* Gross Performance since inception Oct 2011 through Dec 2015 (A Shares)
** Net Performance as of 2016 (B Initial Shares)
Portfolio composition
Number of investments:
14
Invested Long:
60.85%
The start of 2017 was our quietest period so far in terms of portfolio activity. As usual, we spent our time looking for new companies and reading up on companies we owned. Whilst our search was successful, the rewards will have to wait as none of the high-quality companies we identified were being offered to us at a price that meets our risk-reward expectations. In general, we are satisfied with what we currently own and also with how much we own of each individual portfolio company; we hope we can add more of them to the portfolio in the near future. During the quarter, we parted with two companies that had not reached our target valuations yet, but where we concluded that the risks outweighed the rewards. Both are real estate brokerages with leading positions in their markets and both were added to the portfolio at a time when their transaction volumes were far below their long-term yearly averages, this due to a financial crisis for one and extremely high property prices for the other. Both also shared similar investment theories; we would profit considerably upon a return to normality. But that is where their similarities end. First, we had an investment in LSL Property Services Plc (LSL), one of only two large UK focussed real estate brokerage firms. We became part owners of this company in the fall of 2014 at 6x our estimate of normalised earnings. For this undemanding price, we received a quality business, with good management that focussed on shareholder value creation. They generated high free cash flows & high returns on equity, with little need for capex. However, we exited LSL, not because of Brexit nor for fear of an overdue correction in the London bubble market, but because we identified signs of a disruption in the way brokerages earn their fees. For a very long time, property was bought and sold in a way that had not witnessed many changes. However, more recently, market share losses by market leader Countrywide Plc motivated it to introduce a new hybrid pricing model. Starting from a low fixed fee for a basic service, the sellers are now offered additional services at additional costs; a web-based pick and choose model. This offers sellers more choice on how to sell their properties, and will potentially lead to lower margins and fees for the real-estate brokerage industry if fewer sellers go for the full-service option in the future. After meeting with LSL’s management, we were unconvinced they identified this potential threat and we were unimpressed with their determination to act upon it if deemed necessary. We exited LSL at a loss of 24% over our holding period. Our second exit from this industry was Midland IC&I (MIC&I), which is listed in Hong Kong. MIC&I is the leading broker in Hong Kong for non-prime commercial properties. Property transaction volumes fell considerably following the HK government’s initiatives to cool down the market after prices reached stratospheric heights. At our entry price, we paid an enterprise value equal to zero, meaning we paid for the cash on the balance sheet and received the company’s going concern for free. Again, and similar to LSL, we were only looking for some form of normality to return to the long-term transaction volumes to make this a very profitable investment. From the onset, we were aware of corporate governance risks but gave the controlling shareholder the benefit of the doubt. Three years after we made our investment however, he made a move to further his control by letting MIC&I purchase a property he owned. Furthermore, he was not shy to introduce this part-developed property at a profit to him personally. This also diversified the company’s original activities from pure-brokerage to brokerage-developer. This investment was always at the edge of our tolerance in terms of our quality requirements and we finally decided to exit at a small profit to the fund.
As we mentioned in the beginning, when you invest for the long term, periods of low portfolio activity will be inevitable. In our first quarterly letters we set out how the fund came about, what we look for in the companies we invest in and what we aim to achieve for our investment partners and for ourselves. With no specific company to describe this quarter, we thought this to be a good time to look at the framework in which we operate the fund. We were inspired by a recent transcript we read of a speech on Value Investing in China by Mr. Li Lu, an advisor to W. Buffett and C. Munger. Why do we invest in equities and why do we invest globally? It’s very important that our investors understand the answer to these questions. If you don’t understand this, it will be very hard to stay rational during periods of financial distress. We think this knowledge explains why W. Buffett remains convinced that America’s best days lie ahead, despite losing billions during a recession. The next pages are our attempt to assist in understanding this framework.
Why we invest in global equities?
We explain our framework by answering the following three questions:
- Are cash and bonds safer than equities?
- Will equities continue to generate the highest returns in the future?
- Why we take a global approach to equity investing?
Our fund focuses on equity investments because we believe equities will generate the highest return over the long term. We came to this conclusion after studying the returns of different financial assets over a very long period of time. Readers will know we have never had a great exposure to the US market, yet to help us understand, this market is very developed and has good historical data which goes back two hundred years.
Fig.1: Total Real Return Indexes (1801-2014)
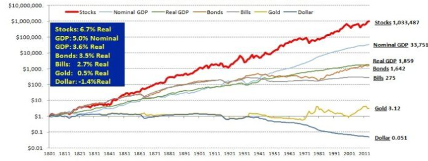
On Fig.1 you can see that over the 200-year period, cash has lost 95% of its value due to inflation. Over the same period (and adjusted for inflation), one dollar invested in short-term government bonds grew to $275 and it grew to $1’642 for an investment in long-term bonds. But the same dollar invested in the stock market, even after allowing for inflation, would have appreciated to just over $1’000’000. The magic of long-term compounding makes that just a few percentage points additional return, make an enormous difference over a long period of time.
Because of the current low interest rate environment, more investors are now aware of the risk of eroding purchasing power when inflation exceeds the interest on bank deposits or on bonds. A negative real return of just 1% to 2% per year already starts to have a real destructive impact after ten years. So while investors view stocks as risky due to their volatility, the long-term evidence shows that it is actually cash that has annihilated purchasing power.
Why did equities do so much better than cash and bonds? Inflation and growth of GDP explains the differences in returns between cash, bonds and equities. From the data we can see that US equities have returned 6.7% p.a. in real terms; this can be broken down in 3.6% revenue growth and 3.1% from improved profit margins. In aggregate, revenue for American companies grows in line with GDP. All these companies incur expenses, some are variable and some are fixed, the latter bearing no impact on sales volumes. This allows for profits to grow at a faster rate than sales. In the long term, this profit growth determines the increase in value of a company.
This brings us to our second question. While historically equities have generated a disproportionate amount of wealth in comparison with other asset classes, is this likely to be true for the future?
In the history of mankind, world GDP has basically been flat until about 300 years ago. The economic progress during the last 3 centuries is clearly unique in our history. Is it a temporary phenomenon or is it likely to continue? Anyone who has an insight into the performance of equities over the last two hundred years and wants to understand their performance over the next two hundred years needs to appreciate the history of human civilisation. To have this perspective for example, is what allows W. Buffett to stay relaxed and optimistic during inevitable periods of financial turmoil. We recommend the books “The rational optimist” by Matt Ridley and “The great convergence” by Richard Baldwin if you are interested to read more on the subject. In the next paragraph we share some of their views.
Fig.2: Social Development in the East and West, 10,000 BC to 2,000 CE

As we can see above in Fig.2, for a variety of reasons, modern science and free markets appeared about 300 years ago as the main sources of wealth creation. By exchanging things, humans discovered ‘the division of labour’; the specialisation of efforts and talents for mutual gain. Specialisation encouraged innovation, because it encouraged the investment of time in the development of tools that made producing more efficient. Efficiency gains implied that the producer needed less time to produce the same output and so was able to increase his production volume. This ‘saved’ time (and prosperity is nothing more than saved time) is proportional to ‘the division of labour’. The more human beings diversified as consumers and specialised as producers, and the more they exchanged, the better off they have been and will continue to be. And the good news is that there is no inevitable end to this process. The more people are drawn into this global ‘division of labour’, the more people can specialise and exchange, and the wealthier we will all become. Fast forward to today in a world that is networked, the pace of innovation will redouble and economic evolution will raise the living standards of the 21st century to unimagined heights. Although such optimism is sometimes contrarian, history suggests it is more realistic than the pessimism we sometimes associate with our future.
Before the dawn of the internet, we witnessed another accelerator of economic growth as the result of the collapse of the Berlin Wall and China’s embrace of a market economy. For the first time in human history we saw real globalisation; participation to the global economy was no longer limited to the developed countries representing less than 20% of world population. A global, unified economic system with free trade, free exchange and free markets at its heart. Markets that enjoyed economies of scale; as the number of participants and exchanges increased, the more incremental value it created. The more efficient the allocation of resources, the more productive, wealthy and successful the economies became, and the more able they will be to produce and support high-end technology. Between two competing markets, the larger market will eventually absorb and become the only market. Any person, industry or country which leaves this largest market will quickly regress and ultimately be forced to re-join. The best way for a country to increase its strength is to lower tariffs and join the global economy; the best way for a country to fall behind is to shut itself off. More and more countries have come to accept this view. China for example, after having tried everything else over 150 years, became a free market economy about 35 years ago. As soon as China went down this path, the performance of its economy, stocks and companies has been nothing less but amazing. What’s the risk that China deviates from this path? Mr. Li Lu has an interesting view on the topic: “If China changes the rules of its market or leaves the common market, it will, in a relatively short time, rapidly fall behind. I am confident that in a country as mature, historically successful and culturally advanced as China, this would not be acceptable to most people. It’s not that there is no chance of China leaving this big market for a brief moment; it’s just that China is unlikely to be a loser forever. Chinese people will not willingly lose after experiencing several millennia of success.”
Based on this thought process we believe growth of world GDP will continue to make equities the asset-class for wealth creation over the long term, and a global approach to equity investing makes a lot of sense. Geographical diversification reduces risk and the larger global investment universe should result in an improved risk-reward for our investments.
***
For the quarter ended March 31, 2017, the fund had 14 listed equity positions. The five largest positions in the fund represented 32.29% of assets under management.
Summary of the five largest positions of the fund:
Boustead Singapore Ltd:
This Singapore-based company is a conglomerate of three quality businesses, which are fundamentally different from each other. The underlying divisions simultaneously went through headwinds, which allowed us to invest at an attractive valuation. Boustead Singapore consists of the following three businesses: 1/ a 51.2% participation in recently spun-off Boustead Projects Ltd; a design-build-lease real estate business that owns a portfolio of new and recently build high-end fully let industrial buildings. It counts IBM, Airbus, Bombardier, Rolls-Royce, SD Schenker and SDV amongst its tenants. 2/ an asset light, global engineering business active in the niche market of direct-fired process heater systems, mainly for oil & gas refineries. 3/ a distribution business of Esri Geospatial Software, which has a 60% market share in geographic information systems (best explained as a professional Google Maps, mainly for governmental use). These three businesses have high operating margins and generate high returns on invested capital. They are led by a chairman who focuses his entrepreneurship on shareholder value creation. We were able to purchase this conglomerate for respectively 5x and 12x the normalised earnings of the energy and geospatial businesses, and paid 55% of intrinsic value for the real estate assets. A potential catalyst exists in moving the real estate assets into a REIT structure and the conservative balance sheet also allows for opportunistic acquisitions.
Exova Group PLC:
Within the TIC industry, London-listed Exova is mainly active in Destructive Testing services, Energy and in some niche sectors of Health Sciences. The company used to be part of a much larger listed company (Bodycote PLC) in the beginning of this century. Fast-forward to an untimely private equity ownership (CD&R), it found its way back to the public markets in the summer of 2014. Subsequently, the market value of the company halved following disappointing earnings releases; unjustified in our opinion, considering the high quality of the underlying cash flow generating businesses. But what makes Exova particularly attractive is that because it’s considerably smaller than its global industry peers, it can make opportunistic acquisitions at lower multiples, which still make a real difference to Exova’s bottom-line. We used the share price volatility to buy into Exova at very attractive levels versus our intrinsic value calculation. We purchased the company using adjusted margins for acquisitions and restructurings at a price/earnings multiple of 12x 2015 earnings, whereas the global peers trade between 18x-22x 2015 earnings. More recently, Exova received an offer from three financial buyers to take the company private again.
EM Systems Co Ltd:
This Osaka-based medical software business is the leader in pharmacy software in Japan. The company sells soft- and hardware to 33% of pharmacies in Japan. The country is not as advanced yet in its implementation of medical software to control and cut public health spending as compared to Western countries. However, our experience in this industry gives us confidence in the future recurring revenue stream. The company is led by an owner-operator with a good track record as both an operator and a capital allocator. When the company recently moved over to a cloud-based subscription model, the market punished the share price, ignoring years of stable future cash flows once the transition was complete. In addition, the company owns a prime office building in central Osaka. We purchased the shares at roughly the value of the real estate, covering our margin of safety. If the company makes good on its promise to sell the real estate, then we will have received this great company almost for free.
Judges Scientific plc:
Judges Scientific (JDG) is listed on AIM, a sub-market of the London Stock Exchange and home to smaller companies with less regulatory burden than the main market. JDG specialises in the acquisition and development of a portfolio of scientific instrument businesses. JDG designs, assembles and sells high quality scientific instruments with a focus on material sciences and vacuum environments. JDG generates sales of approx. £56m; 60% from universities, 10% from testing firms and the rest from a diverse group of researchers with pharma, biotech, commercial and industrial backgrounds. More than 80% of sales are exported. Whilst most of the company's products have a long lifecycle, many of these products are sold into diverse markets and into different countries. The businesses share the following characteristics: sustainable profits and cash flows, high operating margins, high returns on capital, high and stable market shares in small niches, high fixed costs (mostly specialised personnel, many PhD’s), low capital requirements and asset light. Since its IPO in 2005 it generated a total return to shareholders of approx. 28% per annum over the 12-year period. When the company came with two negative trading updates to announce poor operating results for reasons we believe to be of temporary nature, the share price declined to a level we found attractive.
C.Uyemura & Co Ltd.:
The company is active in a niche market of the Electroplating Chemicals Industry and is not particularly small (market capitalisation = ¥53b~US$484m) but does a great job of hiding itself. The company is listed on the Second Section of the Tokyo Stock Exchange, usually reserved for small caps with extreme low transaction volumes. Although the company has a 20-year history of growth and profitability, they never made an effort to get onto the First Section of the Tokyo Stock Exchange, unlike their two main Japanese competitors (JCU & MEC). Whilst the industry is consolidating and at best growing in the single digits, it has very high barriers to entry. The industry has seen no new players for several decades due to product complexity, know-how, customer service capabilities and reputation. There are only a small dozen companies active in this space. The three largest making out 60% of the market and Uyemura, together with three Japanese players have about 20% market share. Electroplating Chemicals are an attractive niche in the surface treatment industry and an important component in the production of printed circuit boards. Whilst the process is critical in the production of mainly mobile phones, PC’s and car electronics, the expense to the client is small in comparison to its overall manufacturing cost. This is a balance we like to see because rational customers don’t act penny wise and pound foolish on the small but critical components of their end-products. Uyemura is either a supplier or sub-supplier to most smartphones including iPhones and also for example for Toyota Motors in the car industry. Even in an environment of slowing demand for mobile phones does Uyemura manage to keep margins high because of the higher specification requirements in the latest smartphones like the iPhone 8 & 9. This business has a very high customer retention rate, is asset-light, operates with high margins and has limited need of extra capital and thus is generating lots of cash. At our purchase price, the company’s market capitalisation is 2/3 covered by cash and 4/5 covered by cash + owned real estate. These excess assets give us good downside protection. The Uyemura family still owns 25% of the company. If we back out net cash & real estate, then we are paying 1.3x EV/EBITDA. We believe this is a very cheap valuation for a good company with a long history of profitability, a stable market share in an industry with very high barriers to entry and the other characteristics we described above.
***
We are grateful for your trust and welcome any remarks or questions you might have with regards to the fund or the strategy.
Best,
Griffin Value Fund

1
Estimate calculated by dividing the annualised return of A-shares by the average of invested capital as a % of AUM, at the end of each month. The difference between the fund’s overall returns and the total returns on equity investments is explained by keeping large cash positions over the years. The fund gradually invested the cash since inception, and did not compromise on the investment criteria for the sole purpose of being fully invested at all times.
2
3
4
5
6
Important Notes
This document is intended for discussion purposes only and does not create any legally binding obligations on the part of Griffin Value Fund and/or its affiliates ("Griffin Fund Sicav-SIF"). Without limitation, this document does not constitute an offer, an invitation to offer or a recommendation to enter into any transaction. When making an investment decision, you should rely solely on the final documentation relating to the transaction and not the summary contained herein. Griffin Value Fund is not acting as your financial adviser or in any other fiduciary capacity with respect to this proposed transaction. The transaction(s) or products(s) mentioned herein may not be appropriate for all investors and before entering into any transaction you should take steps to ensure that you fully understand the transaction and have made an independent assessment of the appropriateness of the transaction in the light of your own objectives and circumstances, including the possible risks and benefits of entering into such transaction. You should also consider seeking advice from your own advisers in making this assessment. If you decide to enter into a transaction with Griffin Value Fund you do so in reliance on your own judgment. The information contained in this document is based on material we believe to be reliable; however, we do not represent that it is accurate, current, complete, or error-free. Assumptions, estimates and opinions contained in this document constitute our judgment as of the date of the document and are subject to change without notice. Any projections are based on a number of assumptions as to market conditions and there can be no guarantee that any projected results will be achieved. Past performance is not a guarantee of future results. Griffin Value Fund prepared this material. The distribution of this document and availability of these products and services in certain jurisdictions may be restricted by law. You may not distribute this document, in whole or in part, without our express written permission. GRIFFIN VALUE FUND SPECIFICALLY DISCLAIMS ALL LIABILITY FOR ANY DIRECT, INDIRECT, CONSEQUENTIAL OR OTHER LOSSES OR DAMAGES INCLUDING LOSS OF PROFITS INCURRED BY YOU OR ANY THIRD PARTY THAT MAY ARISE FROM ANY RELIANCE ON THIS DOCUMENT OR FOR THE RELIABILITY, ACCURACY, COMPLETENESS OR TIMELINESS THEREOF. Griffin Value Fund is regulated by the Commission de Surveillance du Secteur Financier (CSSF) for the conduct of Luxemburg business.